Monitoring and Debugging Using AWS CloudWatch
Posted By : Vanshika Madan | 03-Mar-2020
Amazon provides us many useful services but here we will be discussing its one of the services known as CloudWatch. This service is provided for monitoring AWS resources and applications which we run on AWS. This monitoring tool makes easy for us to easily monitor our application using generated CloudWatch logs and hence help to elucidate data.
Why Use AWS CloudWatch?
1- To collect and track metrics.
2- To collect and monitor log files i.e. recording all events occurring in your application on AWS.
3- To set an alarm that can be set for any threshold i.e. if any resource exceeds that threshold, it will send notification and even automatically take some reactive action against it.
Here AWS resource includes Amazon EC2, instances, Amazon DynamoDB tables, Amazon RDS DB instances as well as custom metrics generated by your application and services.
CloudWatch allows us to track a wide variety of useful metrics for your application:-
1- Resource Utilization
2- Application’s Performance
3- Network Traffic.
4- Memory Utilization
5- Storage space available
6- Operational health
All of the above metrics can be monitored on CloudWatch using following ways:-
1- Amazon CloudWatch Console.
2- AWS CLI
3- CloudWatch API.
4- AWS SDKs
You can use any of the ways to access CloudWatch. Here we will be discussing the Amazon CloudWatch Console.
How To Use CloudWatch?
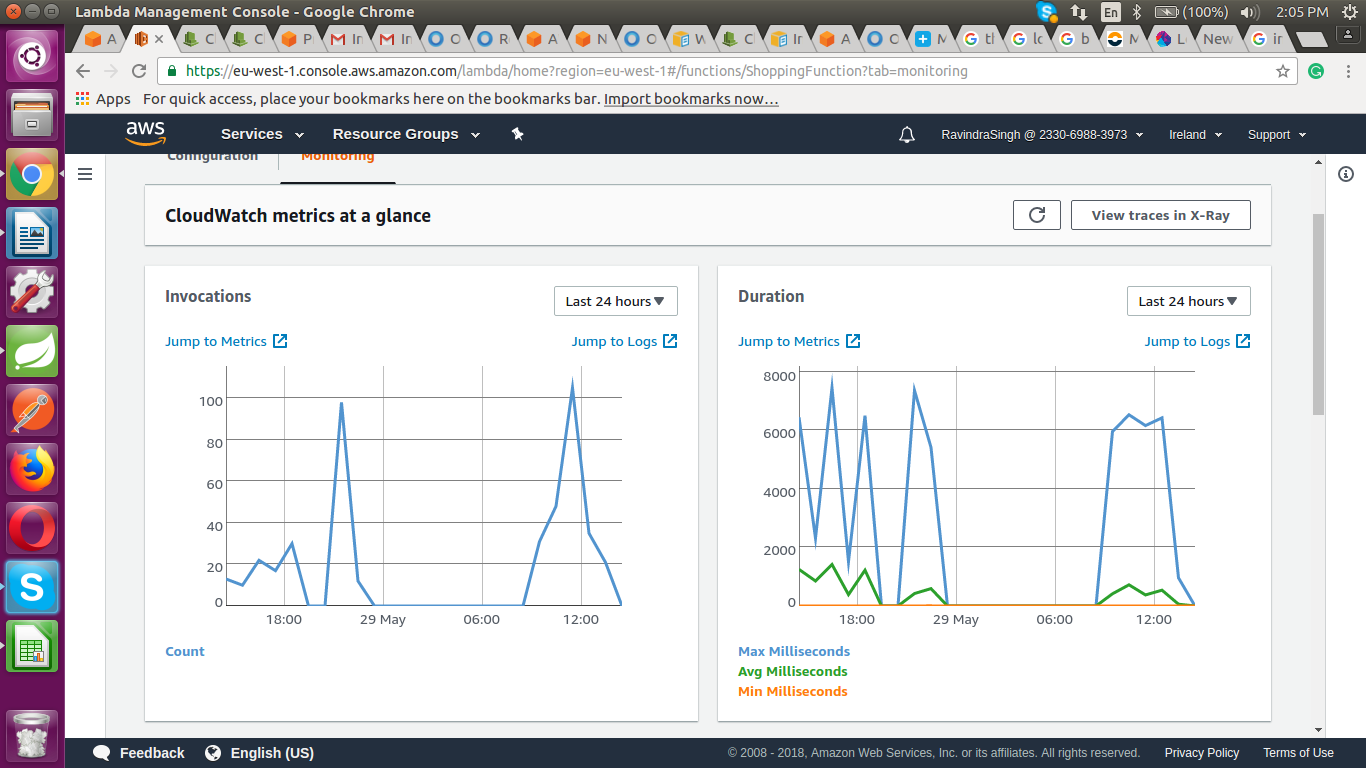
This shows all of the metrics provided by CloudWatch at a glance which allows us to view the system’s performance.

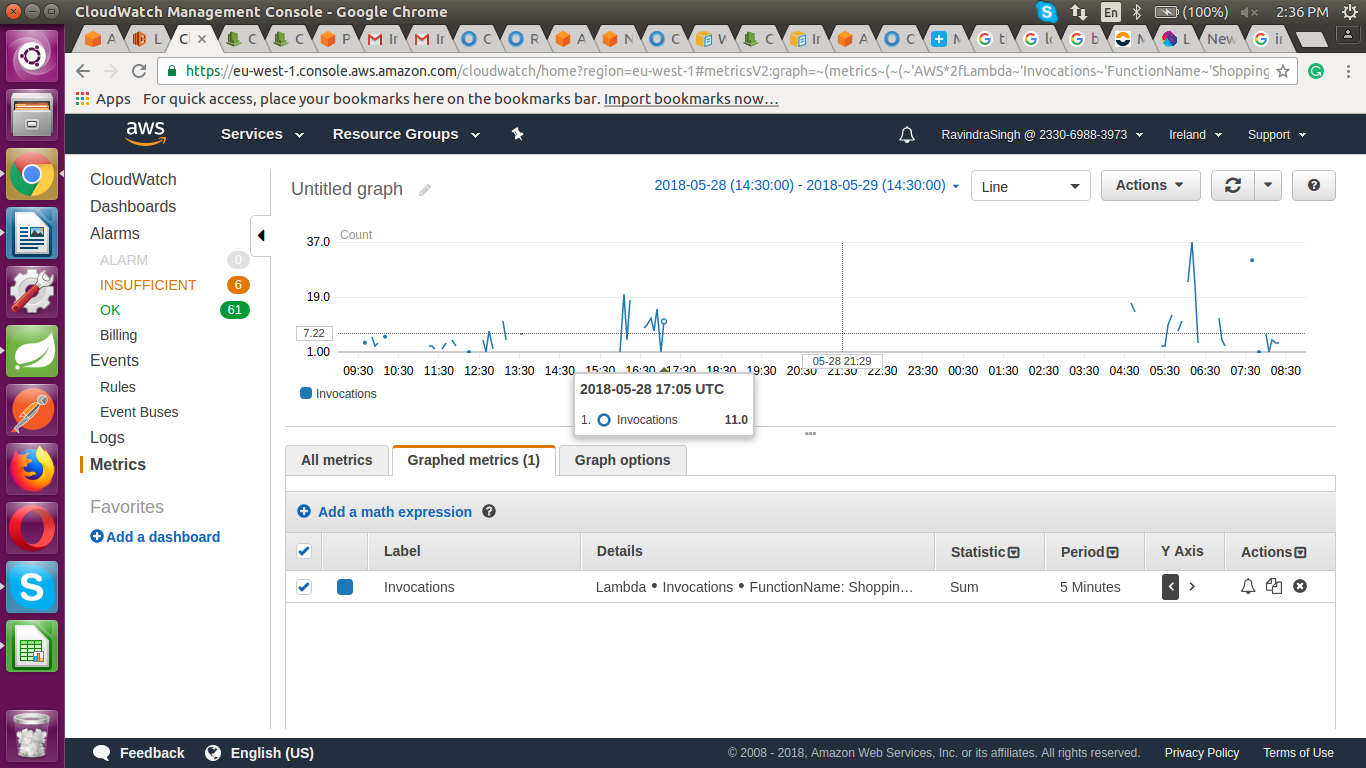
Now we can jump to particular metrics. For example invocation graph which shows the number of hits to the lambda function

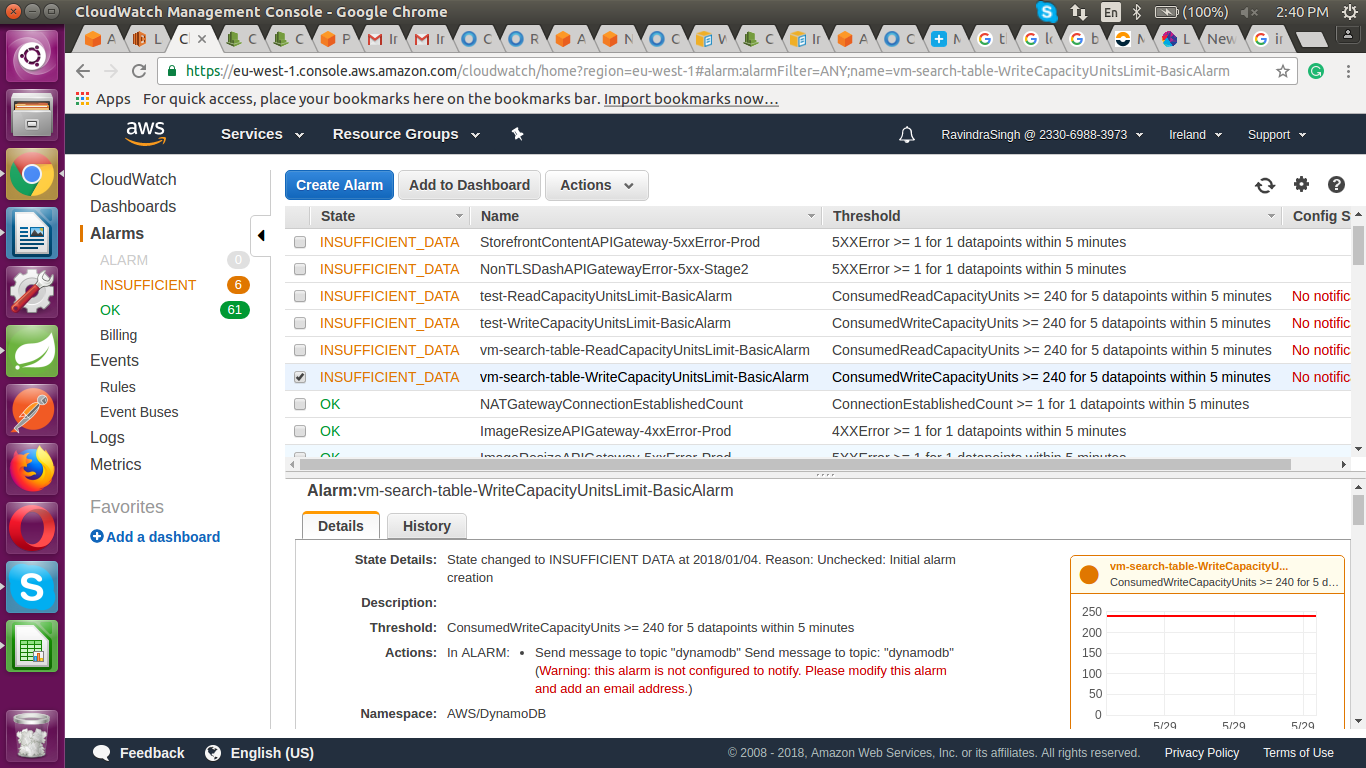
Amazon CloudWatch provides us the functionality of creating alarms so that it send us notification whenever any metrics reach the threshold point. For example:- it will send alarm

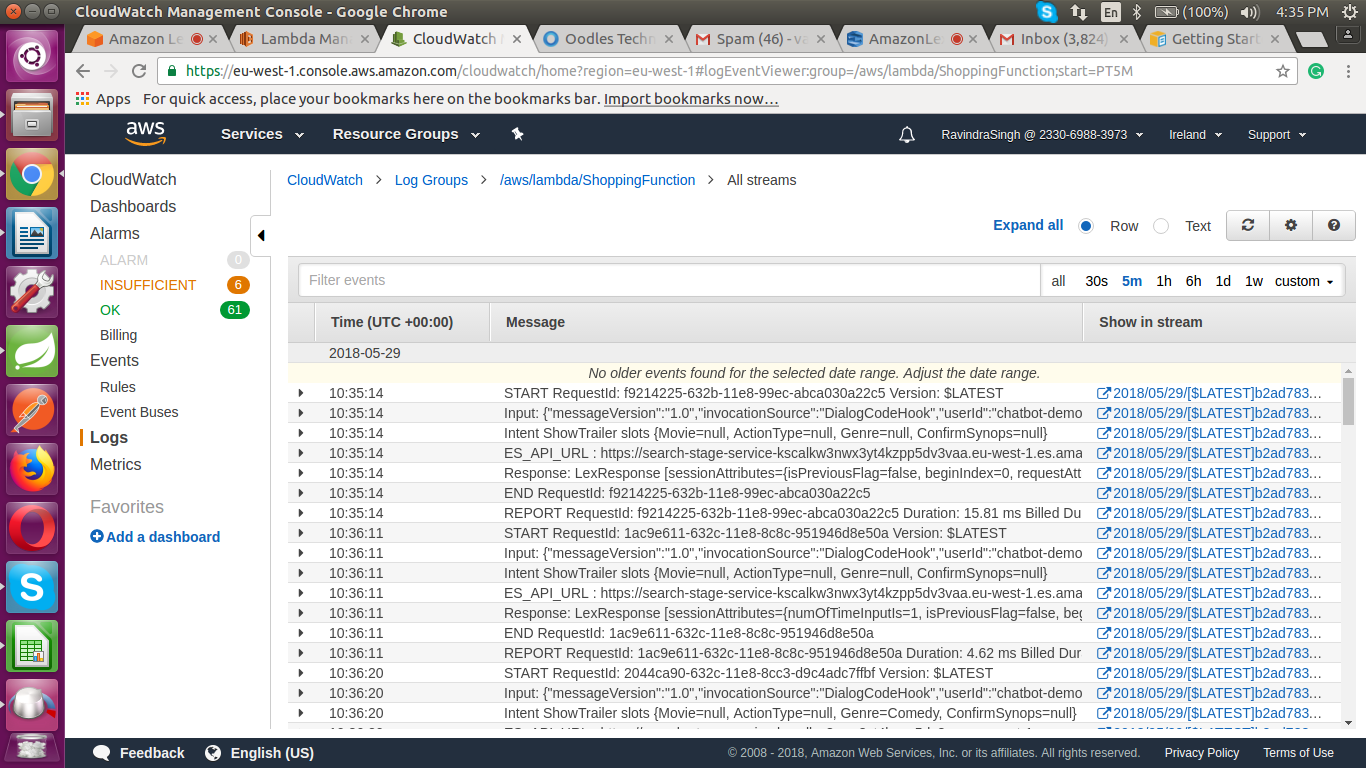
It provides us another option of monitoring application and AWS resource using log data. CloudWatch logs can also be used for tracking the number of errors and it sends a notification whenever the rate of error exceeds the threshold point. Monitoring can be used to detect many times of error such as NullPointerException, NumberFormattingException, etc. Or to monitor the flow of your application.

This is how AWS CloudWatch can be used for Monitoring and hence Debugging.
Our development team specializes in using an exhaustive range of Amazon Web Services including Amazon EC2, Amazon Glacier, Amazon S3, Amazon Elasticache, and more. We analyze your enterprise requirements and formulate effective strategies to deliver data-driven AWS app development services to drive business growth. We have successfully completed several AWS development projects for startups and small-to-medium enterprises (SMEs)
Cookies are important to the proper functioning of a site. To improve your experience, we use cookies to remember log-in details and provide secure log-in, collect statistics to optimize site functionality, and deliver content tailored to your interests. Click Agree and Proceed to accept cookies and go directly to the site or click on View Cookie Settings to see detailed descriptions of the types of cookies and choose whether to accept certain cookies while on the site.


About Author
Vanshika Madan
Vanshika is focused and hardworking person. She aims at achieving new opportunities and secure a position to contribute her skills for growth of the organisation and her professional career.