Google Analytics Charts Using JavaScript
Posted By : Mohit Virmani | 10-Sep-2013
In this blog, I’m going to show the development of Google Analytics' Charts by using the Google Visualization Plugins’ Under The Hood Code, so that you can use the Analytics Charts independently also,i.e., without the need of Google Visualization Plugin.
Below shown is a Google Analytics Chart we are going to make.
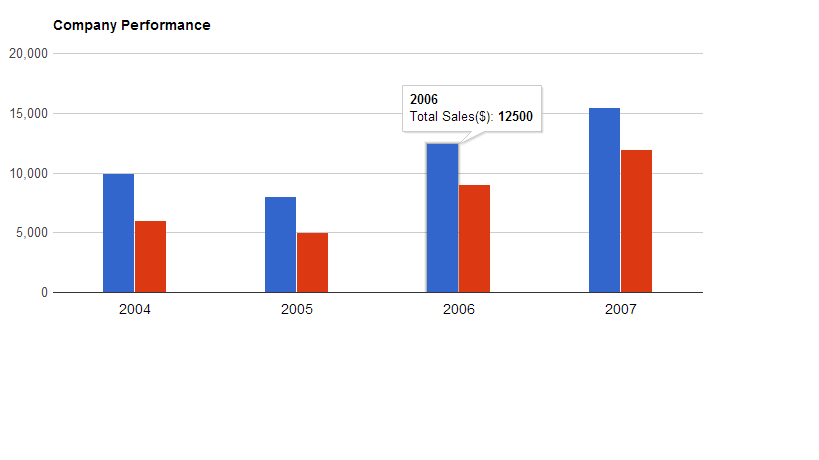
Below are the steps and the code to develop a Column Chart.
1. Create a Grails Project named,e.g., AnalyticsCharts.
2. Create a GSP named, e.g., charts.gsp, and paste the following code.
<html>
<head>
<script type="text/javascript" src="https://www.google.com/jsapi"></script>
<script type="text/javascript">
google.load("visualization", "1", {packages:["corechart"]});
google.setOnLoadCallback(drawChart);
function drawChart() {
var data = google.visualization.arrayToDataTable([  ['Year', 'Sales', 'Expenses'],
    	               ['2004',  1000,      400],
    	               ['2005',  1170,      460],
    	               ['2006',  660,       1120],
    	               ['2007',  1030,      540]
    	             ]);
var options = {
          title: 'Company Performance',
          hAxis: {title: 'Year', titleTextStyle: {color: 'red'}}
        };
var chart = new google.visualization.ColumnChart(document.getElementById('chart_div'));
chart.draw(data, options);
}
</script>
</head>
<body>
<div id="chart_div" style="width: 900px; height: 500px;"></div>
</body>
</html>
Following are some important points regarding the above code:
1. You have to import the “https://www.google.com/jsapi” in the JavaScript tag in the head section of your code.
<script type="text/javascript" src="https://www.google.com/jsapi"></script>
2. Now that we have imported the library required for the functioning of the charts, the next script code adds the package used, defines the onLoadCallBack function named drawChart, and calls it.
 google.load("visualization", "1", {packages:["corechart"]});
 google.setOnLoadCallback(drawChart);
3.The function drawChart() is consists of the following:
a. The variable "data" consists of the actual data to be shown in the graphs, which in this case is a column chart, showing the Year wise Sales & Expenses Of a Company.
		var data = google.visualization.arrayToDataTable([  ['Year', 'Sales', 'Expenses'],
    	               ['2004',  1000,      400],
    	               ['2005',  1170,      460],
    	               ['2006',  660,       1120],
    	               ['2007',  1030,      540]
    	             ]);
b. The variable "options" is used to customize the visuals of the chart, e.g., title of chart, title on hAxis, color, font, etc..
	 var options = {
          title: 'Company Performance',
          hAxis: {title: 'Year', titleTextStyle: {color: 'red'}}
        };
c. The variable chart is used to define the type of chart, e.g., ColumnChart, PieChart, BarChart, etc.. and also declares the div where the chart would be shown.
var chart = new google.visualization.PieChart(document.getElementById('chart_div'));
d. charts.draw() then draws the chart in the defined div.
chart.draw(data, options);
4. The last step is to place the chart at an appropriate position on your web page.
<div id="chart_div" style="width: 900px; height: 500px;"></div>
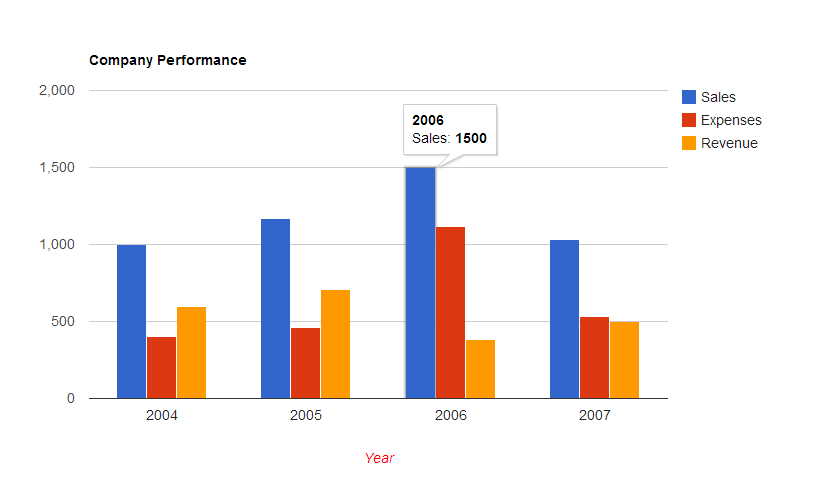
5. One important point regarding data is that we can generate Charts with multiple Bars(1,2,3…..) with the help of modifying the data variable.
The code below will modify the chart to show Revenue of the company, in addition to Sales and Expenses.
	var data = google.visualization.arrayToDataTable([
          ['Year', 'Sales', 'Expenses', 'Revenue'],
          ['2004',  1000,      400 , 600],
          ['2005',  1170,      460 , 710],
          ['2006',  1500,       1120 ,380 ],
          ['2007',  1030,      530 , 500]
        ]);
The output after modifying the code:
Thus, the above description and examples shows the usage of Google Visualization Plugin's Under the Hood Code to generate Analytics' Charts.
Also, you can take a look at the Charts Gallery to view the available charts by visiting here
Thanks,
Mohit


About Author
Mohit Virmani
Mohit is a bright Vice President - Technology with deep technical expertise in Java , Spring , Grails etc.