Drawing graphs in Android using aChartEngine charting library (Pie Charts)
Posted By : Ankush Gulati | 03-Feb-2013
Using Pie Charts in Android
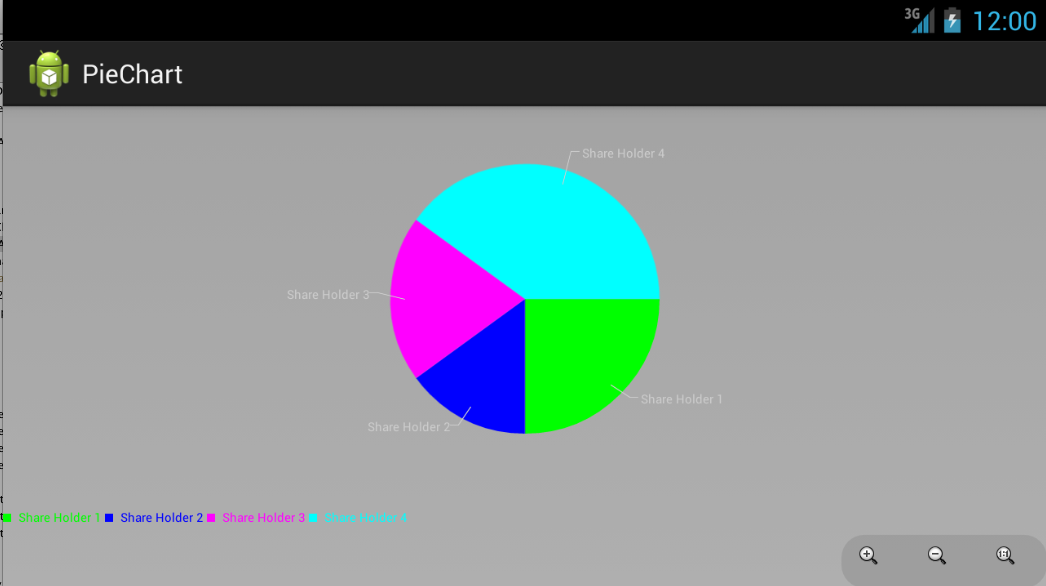
1) We will create a sample pie chart displaying % of shares held by four different personnels.
2) aChartEngine has the capability to show Pie Chart in two ways too i.e.
a) As a separate Activity.
b) as a view to be embedded in current activity.
c) we will be using the second approach, but we will be creating a new activity PieChart and then we will embed the PieChartView in that activity.
3) So, first of all, create a new android activity and name it as PieChart.
4) Now, navigate to "/res/layout" and select the xml file associated with above activity. In this case, activity_pie_chart.xml and paste the following code there.
<?xml version="1.0" encoding="utf-8"?>
<LinearLayout xmlns:android="http://schemas.android.com/apk/res/android"
	android:orientation="vertical" android:layout_width="fill_parent"
	android:layout_height="fill_parent">

	<LinearLayout android:id="@+id/chart" android:orientation="horizontal"
		android:layout_width="fill_parent" android:layout_height="wrap_content" android:layout_weight="1" />

</LinearLayout>
.
Notice that we have created an empty container with id "chart". This layout will contain the actual pie chart generated.
5) Now, navigate to PieChart.java file and replace the code with below code:
import org.achartengine.ChartFactory;
import org.achartengine.GraphicalView;
import org.achartengine.model.CategorySeries;
import org.achartengine.renderer.DefaultRenderer;
import org.achartengine.renderer.SimpleSeriesRenderer;

import android.app.Activity;
import android.graphics.Color;
import android.os.Bundle;
import android.view.Menu;
import android.view.ViewGroup.LayoutParams;
import android.widget.LinearLayout;

public class PieChart extends Activity {

	int[] pieChartValues={25,15,20,40};

	  public static final String TYPE = "type";
	  private static int[] COLORS = new int[] { Color.GREEN, Color.BLUE, Color.MAGENTA, Color.CYAN };
	  private CategorySeries mSeries = new CategorySeries("");
	  private DefaultRenderer mRenderer = new DefaultRenderer();
	  private GraphicalView mChartView;


	@Override
	protected void onCreate(Bundle savedInstanceState) {
		super.onCreate(savedInstanceState);
		setContentView(R.layout.activity_pie_chart);

		    mRenderer.setApplyBackgroundColor(true);
		    mRenderer.setBackgroundColor(Color.argb(100, 50, 50, 50));
		    mRenderer.setChartTitleTextSize(20);
		    mRenderer.setLabelsTextSize(15);
		    mRenderer.setLegendTextSize(15);
		    mRenderer.setMargins(new int[] { 20, 30, 15, 0 });
		    mRenderer.setZoomButtonsVisible(true);
		    mRenderer.setStartAngle(90);

		    if (mChartView == null) {
			      LinearLayout layout = (LinearLayout) findViewById(R.id.chart);
			      mChartView = ChartFactory.getPieChartView(this, mSeries, mRenderer);
			      mRenderer.setClickEnabled(true);
			      mRenderer.setSelectableBuffer(10);
			      layout.addView(mChartView, new LayoutParams(LayoutParams.FILL_PARENT,
			          LayoutParams.FILL_PARENT));
			    } else {
			      mChartView.repaint();
			    }
			fillPieChart();
	}

	public void fillPieChart(){
		for(int i=0;i<pieChartValues.length;i++)
		{
			 mSeries.add(" Share Holder " + (mSeries.getItemCount() + 1), pieChartValues[i]);
		        SimpleSeriesRenderer renderer = new SimpleSeriesRenderer();
		        renderer.setColor(COLORS[(mSeries.getItemCount() - 1) % COLORS.length]);
		        mRenderer.addSeriesRenderer(renderer);
		        if (mChartView != null)
		           mChartView.repaint();
		}
	}

	@Override
	public boolean onCreateOptionsMenu(Menu menu) {
		// Inflate the menu; this adds items to the action bar if it is present.
		getMenuInflater().inflate(R.menu.activity_main, menu);
		return true;
	}
}
a) The working of code is almost similar to that of Bar chart. Renderer is used to actually draw the Pie chart and we created a Dataset as a sample array:
int[] pieChartValues={25,15,20,40};
It may vary according to your requirements.
b) Then, we declare the different colors which will be used the differentiate the graph area. In our case,
private static int[] COLORS = new int[] { Color.GREEN, Color.BLUE, Color.MAGENTA, Color.CYAN };
c) Then we have to declare some basic characteristics for renderer such as title, title size, margin, zoom option or start angle etc. You can always modify it as per requirements. Since we are using another activity to display the Pie chart so we declare it in onCreate method of PieChart activity.
d) Then we actually create reference of the "chart" layout we created in step 4 and assign the "chartView" to it and call the fillPieChart() method.
 if (mChartView == null) {
			      LinearLayout layout = (LinearLayout) findViewById(R.id.chart);
			      mChartView = ChartFactory.getPieChartView(this, mSeries, mRenderer);
			      mRenderer.setClickEnabled(true);
			      mRenderer.setSelectableBuffer(10);
			      layout.addView(mChartView, new LayoutParams(LayoutParams.FILL_PARENT,
			          LayoutParams.FILL_PARENT));
			    } else {
			      mChartView.repaint();
			    }
			fillPieChart();
e) The Fx fillPieChart() populates the Pie Chart with the values provided in as in given step a.
6) Now, the working of PieChart is complete. So, we just need to start this activity when required. So, navigate to your activity_main.xml file, create a new button as:
    <Button
        android:id="@+id/generatePieChart"
        android:layout_width="wrap_content"
        android:layout_height="wrap_content"
        android:layout_alignParentTop="true"
        android:layout_marginTop="45dp"
        android:text="Generate Pie Chart --->" />
7) Now in your MainActivity.java file, start the PieChart activity on click of this button as:
		Button genPieChart=(Button)findViewById(R.id.generatePieChart);
		genPieChart.setOnClickListener(new OnClickListener(){
			public void onClick(View v) {
				Intent pieChartIntent=new Intent(MainActivity.this,PieChart.class);
				startActivity(pieChartIntent);
			}
		});
8) Now, run your project in emulator or device, click on "generate Pie Chart -->" button and you will see something like below screenshot.
Hope it helps :)
Ankush Gulati


Cookies are important to the proper functioning of a site. To improve your experience, we use cookies to remember log-in details and provide secure log-in, collect statistics to optimize site functionality, and deliver content tailored to your interests. Click Agree and Proceed to accept cookies and go directly to the site or click on View Cookie Settings to see detailed descriptions of the types of cookies and choose whether to accept certain cookies while on the site.


About Author
Ankush Gulati