Description Of Top Command In Linux
Posted By : Vishnu Gaur | 26-Dec-2017
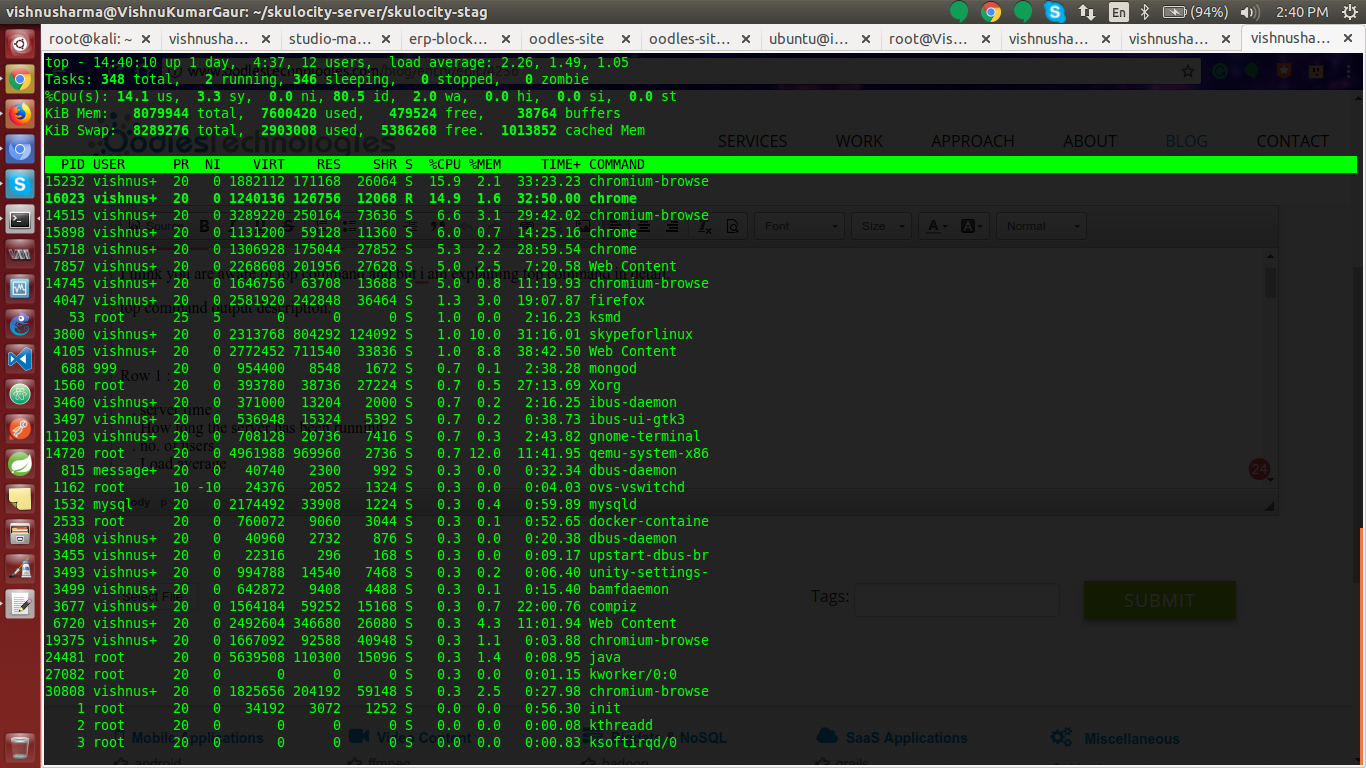
Depth description of TOP command:--->>
I think you are aware of top command and but
top command output description.

Row 1 :
. server time
. How long the server has been running
. no. of users
. Load average
The Load average have three sections which
Row 2 :
. Total no. of Tasks
. No. of running tasks
. No. of sleeping tasks
. No. of stopped tasks
. No. of zombie tasks
Row 3:
. Cpu usage (%) percentage by the user (us)
. Cpu usage (%) percentage by the system (
. Cpu usage (%) percentage by the low priority processes(ni)
. Cpu usage (%) percentage
. Cpu usage (%) percentage
. Cpu usage (%) percentage
. Cpu usage (%) percentage
. Cpu usage (%) percentage
Row 4:
. Total memory
. Free memory
. Memory used
. Buffer cache
Row 5:
. Total swap memory available
. Total swap memory free
. Total swap memory used
.
Column 1 :
. Process ID of the particular service.
Column 2:
. User (which user running a particular service it may be root or any other
Column 3:
. Priority
Column 4:
. Nice level (which is decide priority of service. we can set nice value of running process
Column 5:
. Virtual memory used by a particular process
Column 6:
. Resident memory used by a particular process
Column 7:
. Shareable memory
Column 8:
. CPU used by a process
Column 9:
. Memory used by a process
Column 10:
. Time process has been running
Column 11:
.
Some useful example of TOP command:--->>
top -u (username)
It
. Press z will display running processes in
. Press c will
. Change delay and
. Kill a process press 'k' and kill any process without exit top command
. Renice a process press 'r' and give value without exit top command
. save top command output result
top -n 1 -b > output.txt
. Press 'h' for help
. Exit top command after repetition
To get a list of the columns with which you can sort the top command by type the following:
top -O
There are a lot of columns so you might wish to pipe the output to less as follows:
top -O | less
top -n 10 (no. of repetition)
list of the columns which we can sort the top command by type the following:
top -O
to sort the %MEM & %CPU uses by below commands.
top -o %MEM
top -o %CPU
Cookies are important to the proper functioning of a site. To improve your experience, we use cookies to remember log-in details and provide secure log-in, collect statistics to optimize site functionality, and deliver content tailored to your interests. Click Agree and Proceed to accept cookies and go directly to the site or click on View Cookie Settings to see detailed descriptions of the types of cookies and choose whether to accept certain cookies while on the site.


About Author
Vishnu Gaur
Vishnu Gaur Is DevOps Engineer in oodles technologies, He is a certified Engineer. His hobbies are reading Books and exploring New places